How to Create a Bar Chart in Google Sheets (Step-by-Step Guide with Images)
Bar charts are one of the most effective ways to compare data across categories. Whether you're analyzing sales performance, tracking project progress, or comparing survey results, Google Sheets makes it simple to create professional bar charts that clearly communicate your insights.
In this step-by-step guide, you'll learn how to create and customize bar charts in Google Sheets - from organizing your data to advanced formatting options that make your visualizations stand out.
In This Guide:
Step 1: Prepare Your Data
Before creating your bar chart, organize your data in a clear, logical format. Typically, you'll have categories in one column and their corresponding values in another. This clean structure ensures Google Sheets can generate an accurate chart.
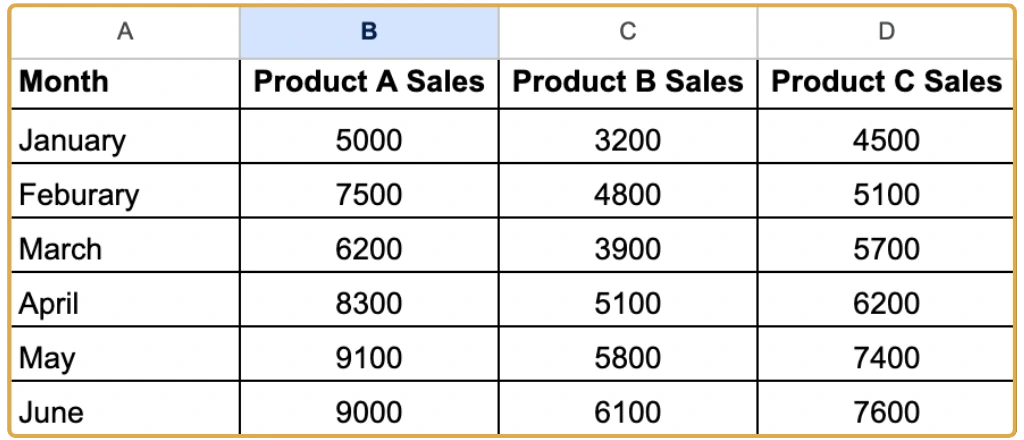
Pro Tips:
- Remove any blank rows or columns within your data range
- Use clear, descriptive labels for your categories
- Format dates consistently if your data includes time periods
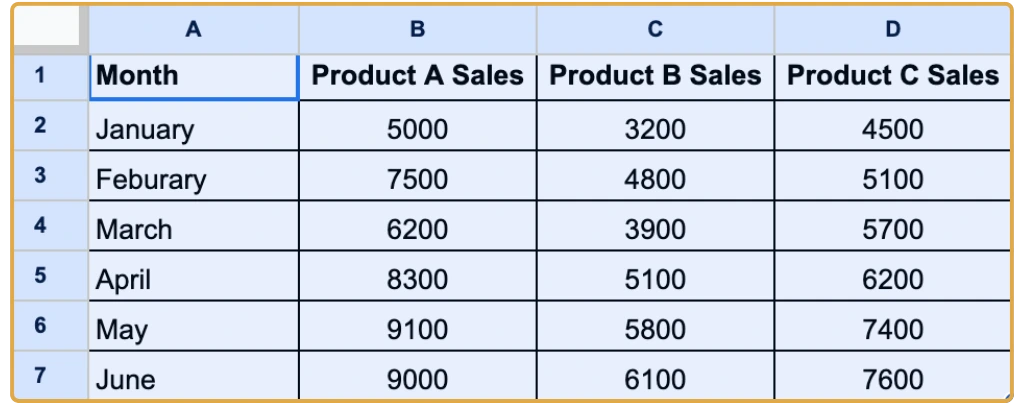
Step 2: Select Your Data
Highlight all cells containing your data, including column headers. Make sure you've selected both your categories and their values. You can drag to select or use Shift + Arrow keys for faster selection.
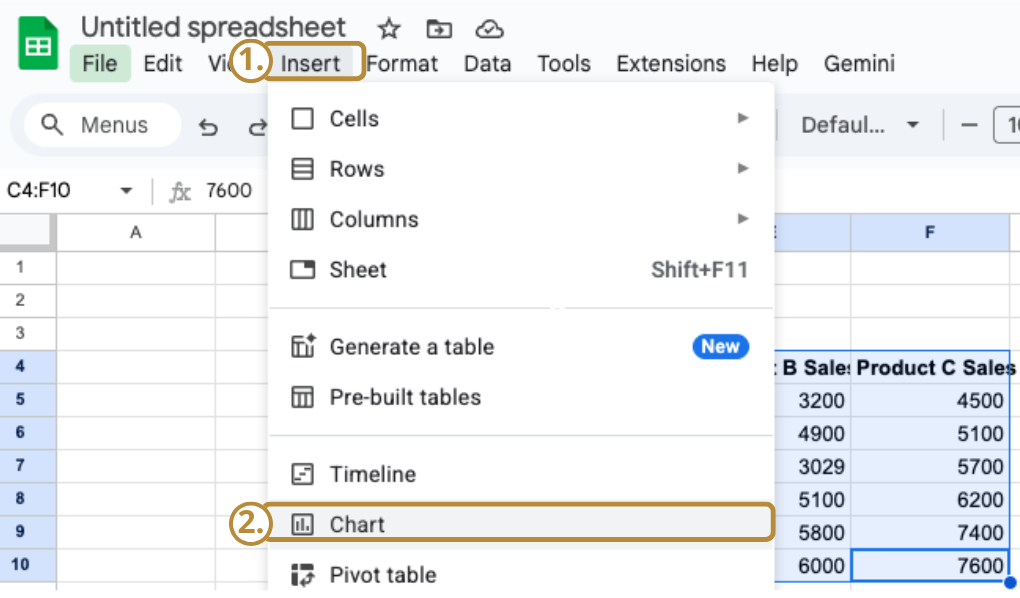
Step 3: Insert the Chart
With your data selected, create the chart:
- Click Insert in the top menu
- Select Chart
- Google Sheets will automatically generate a chart based on your data
The Chart Editor panel will appear on the right, where you can customize your chart type and styling.
Step 4: Choose the Bar Chart Type
In the Chart Editor panel on the right:
- Click the Setup tab
- Open the Chart Type dropdown
- Select Bar Chart (vertical or horizontal)
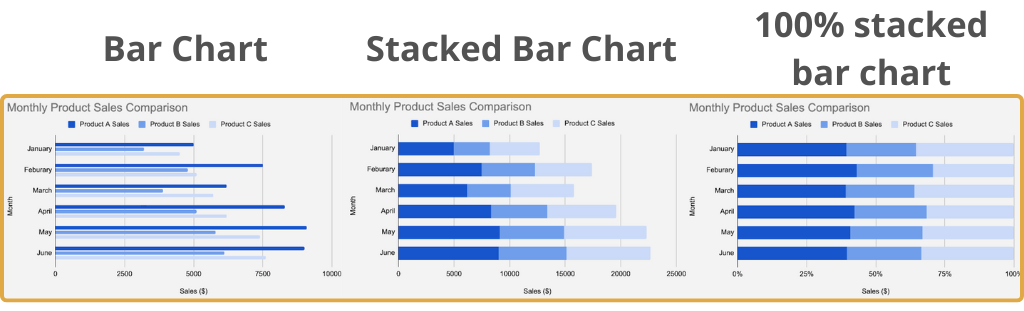
Google Sheets offers three main bar chart types to suit different visualization needs:
Standard Bar Chart
Displays separate bars for each category. Best for comparing independent values across different groups.
→ Use for most comparisons
Stacked Bar Chart
Stacks multiple data series within each bar to show both totals and individual contributions. Perfect for part-to-whole analysis.
→ Use for group breakdowns
100% Stacked Bar Chart
Each bar represents 100% of the total, making percentage distributions easy to compare across categories.
→ Use for percentage comparison
Quick Tips:
- Vertical bar charts work well for time-based comparisons
- Horizontal bar charts are better for long category names or many categories
Step 5: Customize Your Chart
Transform your basic bar chart into a professional visualization with these customization options. All settings are accessible through the Chart Editor's Customize tab.
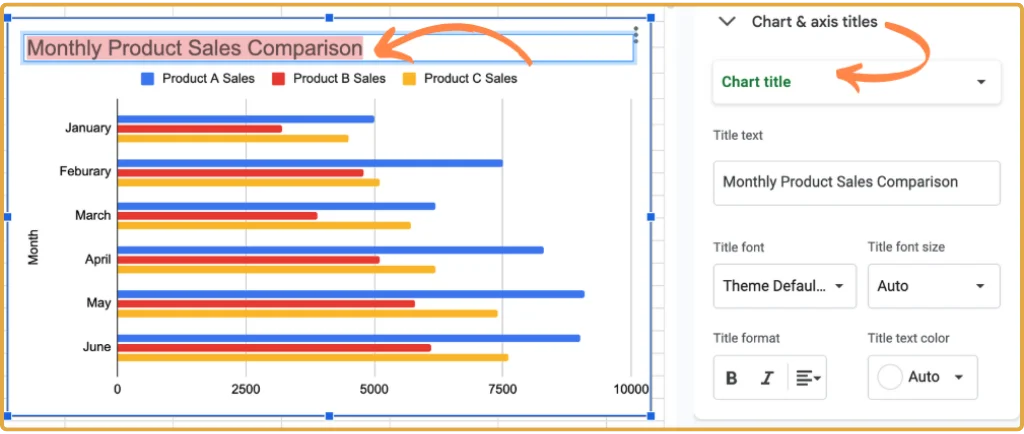
Chart Title
Click directly on the chart title to edit it. Type a descriptive title that clearly explains what your data represents, such as "Monthly Sales Performance" or "Product Comparison Q4 2024."
You can customize the title's font, size, and style through the Chart Editor to match your document's theme.
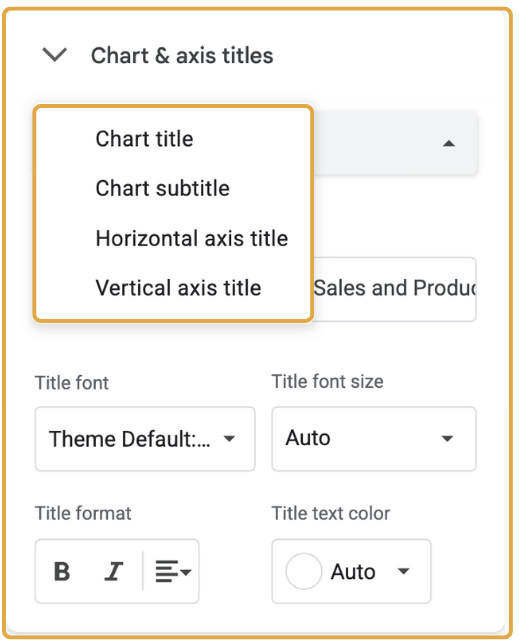
Axis Titles
Axis titles provide essential context for your chart:
- Navigate to Customize → Chart & Axis Titles
- Add descriptive titles for both axes (e.g., "Month" and "Sales ($)")
- Adjust font, size, and style to ensure readability
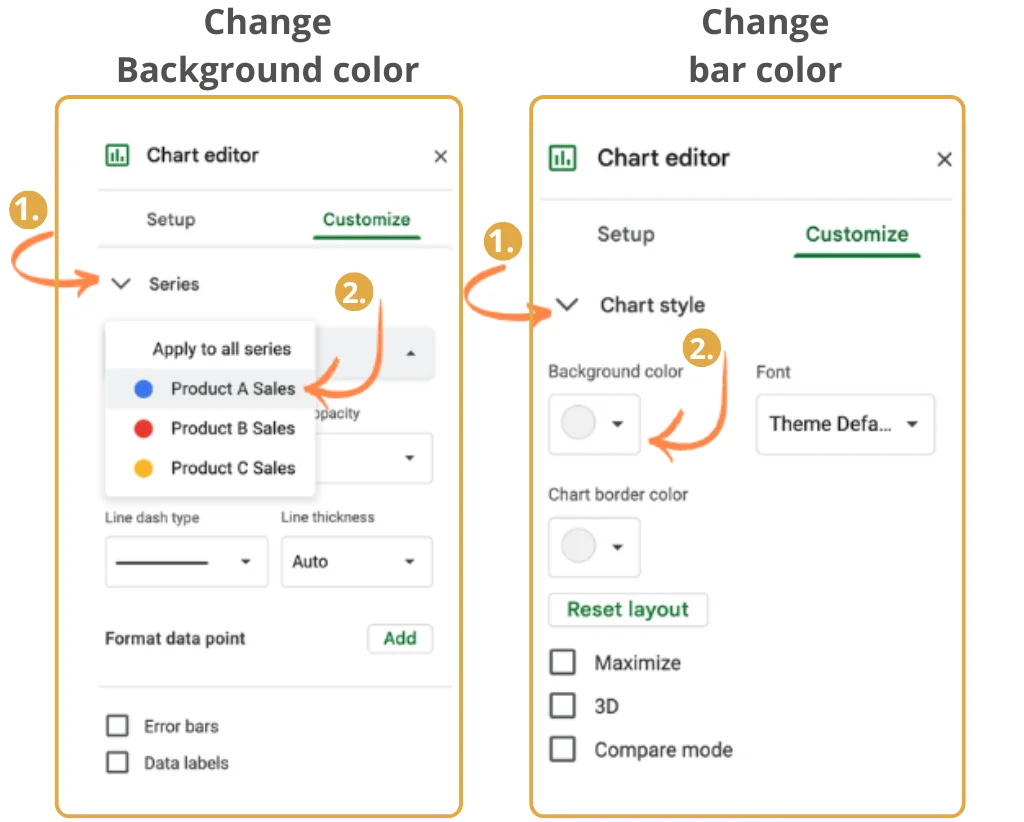
Colors and Chart Style
Colors can make or break your chart's effectiveness. In the Customize tab:
- Bar Colors: Select Series to choose colors for each data series. Use contrasting colors to differentiate between categories.
- Background Color: Under Chart Style, change the background to complement your bars.
- Border Color: Add or modify borders to make your chart stand out.
Need help with color choices? Check out our Guide to Using Colors in Charts.
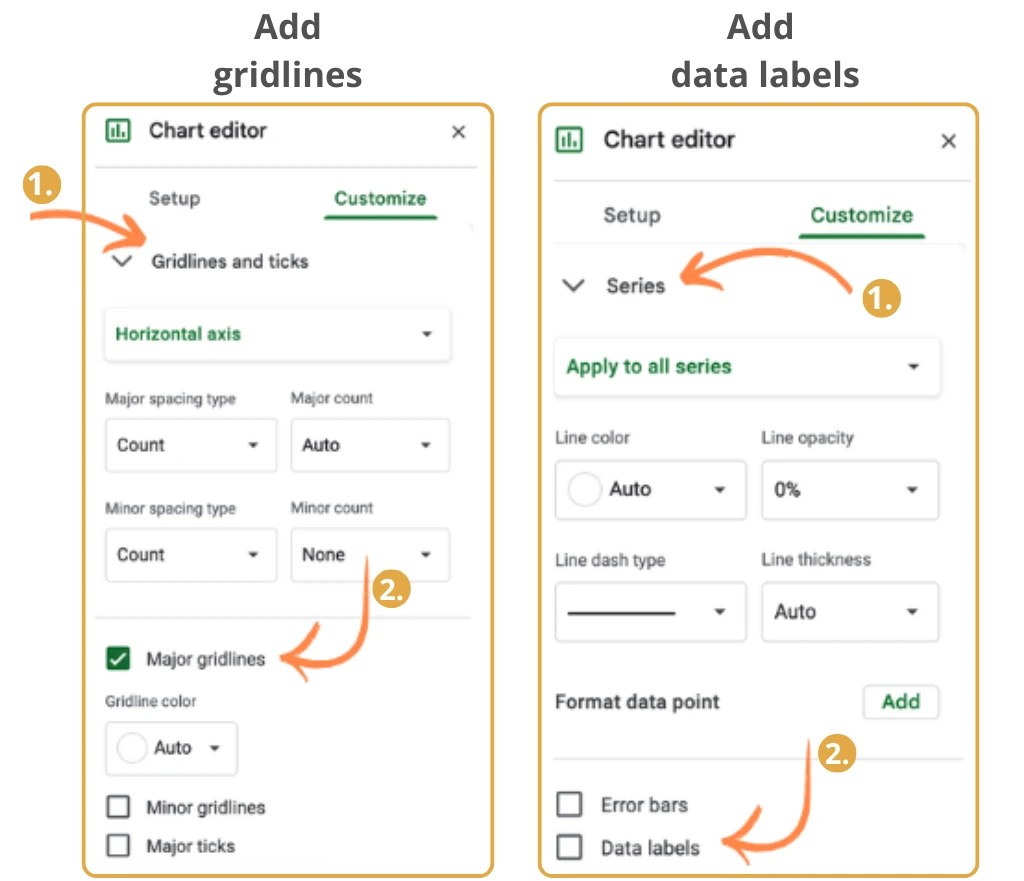
Gridlines and Data Labels
Gridlines help readers interpret values more accurately. Navigate to Customize → Gridlines and Ticks to adjust major and minor gridlines. Keep them subtle to avoid visual clutter.
Data Labels display exact values on bars. Enable them under Customize → Series by checking the Data Labels box. Position them carefully to avoid overlapping with bars.
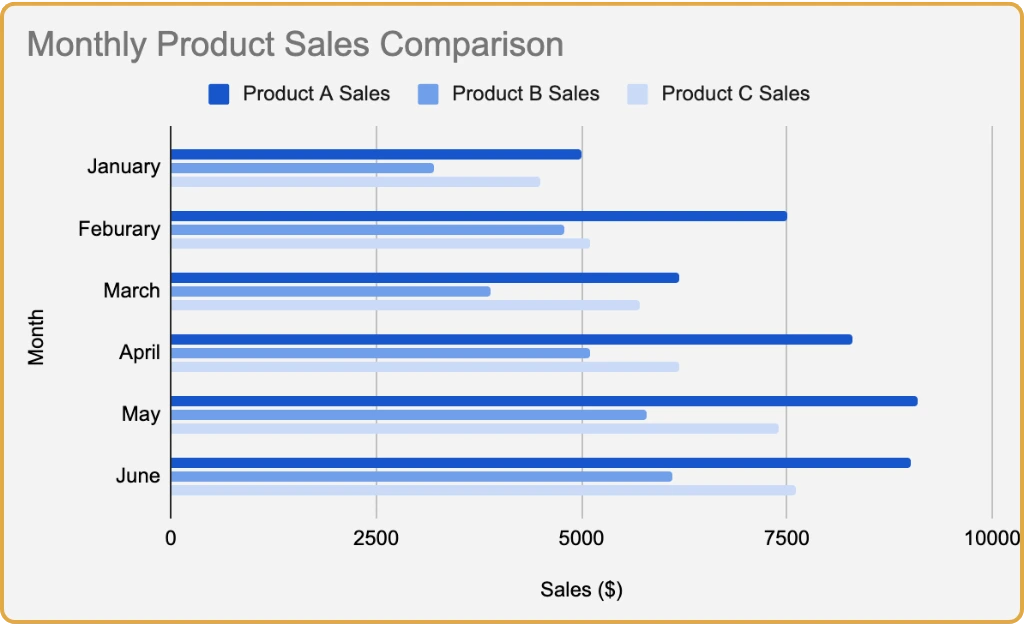
Final Result
With all customizations applied, your bar chart should clearly communicate your data while maintaining professional styling. Here's an example of a finished chart:
Step 6: Export & Share Your Chart
Once you're satisfied with your bar chart, you have several options for sharing:
Download
Click the three dots on your chart → Download as PNG, PDF, or SVG
Copy & Paste
Insert directly into Google Docs, Slides, or other applications
Publish Online
Go to File → Publish to the web for an embeddable link
Final Thoughts
Creating bar charts in Google Sheets is a fundamental skill for anyone working with data. Whether you're presenting to stakeholders, creating reports, or analyzing trends, bar charts provide a clear, visual way to compare information across categories.
The key is to start with well-organized data and use customization options thoughtfully. Experiment with different chart types, colors, and labels to find what best communicates your message. With practice, you'll create compelling visualizations that turn raw numbers into actionable insights.
Need More Advanced Charts?
While Google Sheets is excellent for basic bar charts, professional presentations often require more sophisticated charting capabilities. Chartbuddy brings advanced chart creation directly to Google Slides - including waterfall charts, Mekko charts, and extensive customization options.
Install Chartbuddy